So you first draw lines: (Source)
Then you add some cute little dots and some other squiggly stuff below. Write intelligent things next to them. (Source)

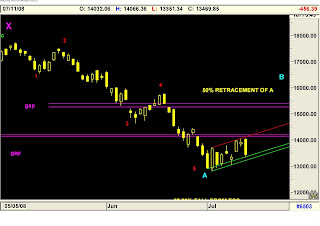
Then you step into stage two – where there aer lines, curves, little numbers from 1 to 5, the alphabets A to Z, and if possible lots of numbers written on the right hand side coloured in blue, red, green, black and yellow. Note carefully that the dots and lines will intersect all over the place and you must write the numbers and digits next to such intersections, not randomly suspended in space. (Source)

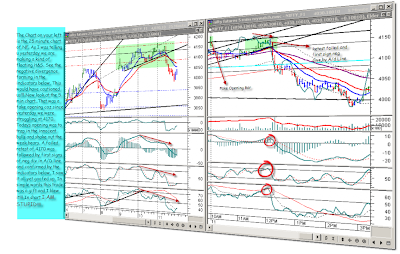
Then you can graduate to the absolute peak of chart analysis, where you even tilt your charts sideways and have multiple consecutive squigglys, arrows, coloured marks, numbers, digits, multiple curves intersecting each other and also the other lines, and notes on the side: (Source)
Beyond this you reach areas which I can only dream of, such as not just recognising patterns but patiently identifying a one-time sudden unexpected event otherwise called a black swan. (Source)

Notes:
1) This is a joke.
2) I would actually read more into (some of) the charts above. Except the last one.
3) This is not meant to berate technical analysis or any of the bloggers above. I think they do a commendable job.
4) But it was worth a little time on Saturday, no?