We resume the Technical Analysis Tutorial Series by visiting an indicator known as the MACD – the Moving Average Convergence Divergence Indicator.
[level-capmind-pro]
MACD was developed in the 1970s by Gerald Appel, and uses two trend indicators (different moving averages) to track momentum in the market. Typically, the combination of trend and momentum is a strong indicator for near term stock movement.
How It’s Calculated
The way to do it is to find the distance between two moving averages. Typical values are:
• Take the 26 day moving average (slow MA )
• And the 12 day moving average (fast MA)
• Subtract the first from the second to give you an MACD.
• This line is compared to its own 9 day Exponential Moving Average, called the “Signal Line”
• That would give you an MACD (12, 26, 9)
You have two ways to plot this:
• Plot the MACD and the Signal line together.
• Plot the difference between the two as a histogram column chat.
We plot both in our Snap Charting area. (You click the “indicators” button, or the “/” key on the keyboard and then find the MACD indicator by just typing MACD)
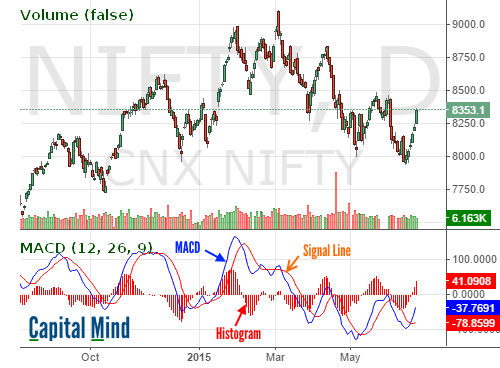
The chart of the Nifty shows the MACD, the Signal Line and the Histogram.
How to Interpret the MACD for Trading
The MACD does not have an upper or lower bound, so it can be at +100, go to -10, come back to +200. There is no “overbought” or “oversold” level.
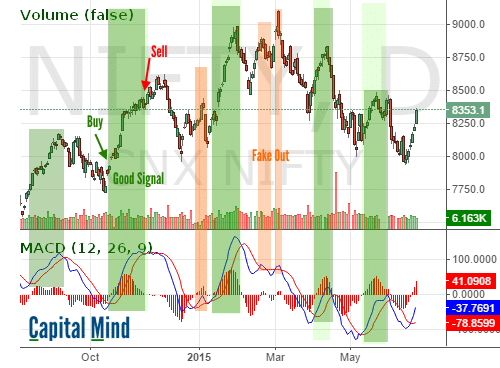
The idea then is to trade specific signals within the MACD.
The most obvious is the Crossover. When the MACD crosses over the Signal Line, the histogram turns from negative to positive. This indicates a positive move. Buying on the crossover is usually a positive. The chart below shows such moves.
A second layer: Zero Line Crosses. When the MACD line is below zero, it means the 12 MA is lower than the 26 MA. That typically is a downtrend, and any upside crossovers are not very reliable. Like in this Cairn Chart:
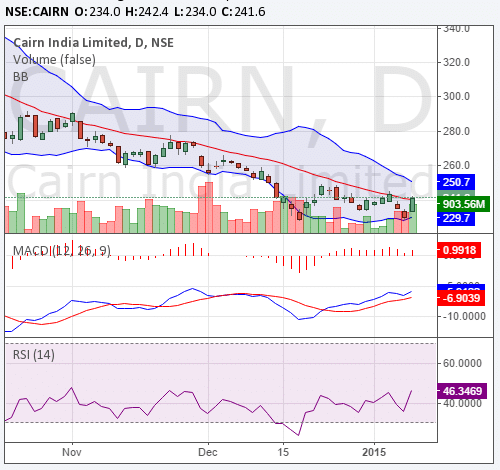
Your long position would be static even though the MACD is going up. The signal changes when the stock does an actual crossover of the zero line; that move is more likely to be reliable. A zero line cross by the MACD can be treated as a positive signal, and traded accordingly.
You might also trade histogram reversals. That means you don’t actually wait for a crossover, just the histogram changing direction substantially is enough for an exit. This is not something we recommend on a daily timeframe as you get chucked out of good long trades. But on an intraday basis, we see that histogram reversals provide decent points of exit in a mean reverting stock.
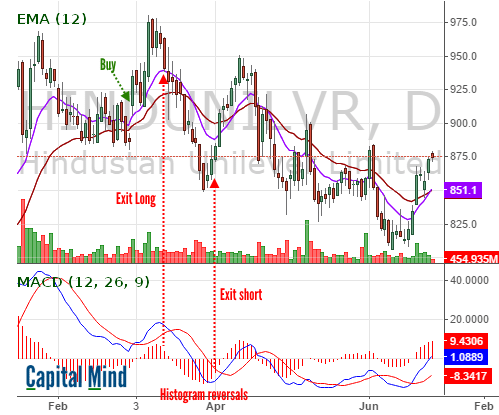
Lastly, you could trade divergences. That means, price makes a lower low and MACD doesn’t, or it makes a higher low. Like so:
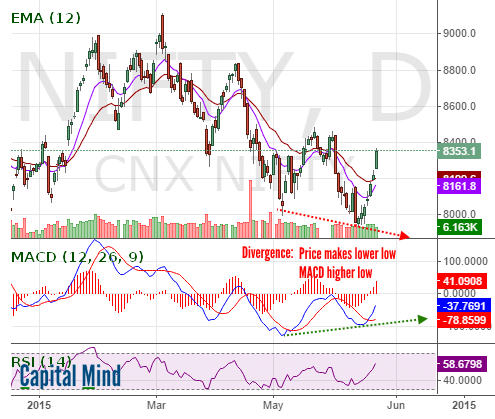
You can do this to recognize peaks as well. (In the above chart, you can see that happened in March).
What We Think
MACD is a very smart daily indicator, and even better on weeklies. In fact, the 26, 12 design was supposed to be on weeklies – 26 is about half a year, and 12 is about three months. For a daily timeframe you could use a different set of parameters – we have used 34, 13 and 21, 5 with some interesting effect. But 26,12 is usually good enough.
We like the MACD even though it’s a little slow. Anything based on moving averages tends to be a little slow anyhow. But it provides access to huge trending moves. Which means even if you get a few whipsaws in some places, just one trade will make you back all the money you lost and then some.
MACD works well with trending stocks, if you use the crossovers or zero line crosses as strategies. Histogram reversals seem to only work in conjunction with other strategies, like breakouts.
The simplicity of the MACD attracts us. There are more complex trend indicators and volume based indicators as well, but we believe the MACD is useful to look at in conjunction with those indicators because it simply embodies a price trend and accelerating momentum.
MACD in Capital Mind Snap!
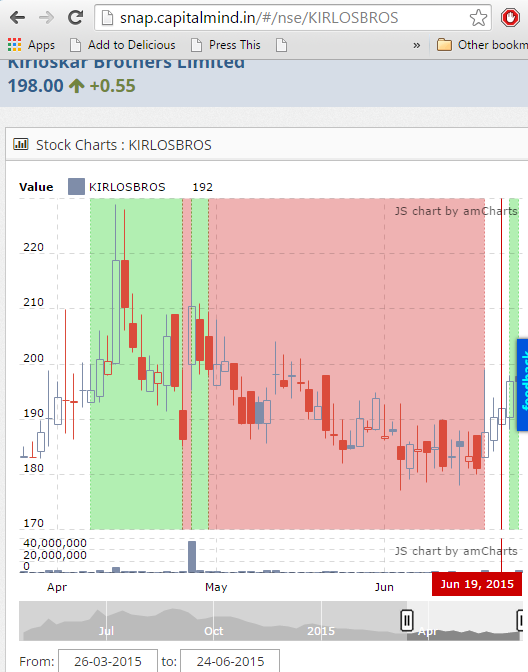
In our upcoming Snap tool, where we have Company Pages, you will find the charts coloured according to MACD. That means the Red zones are where MACD shows a negative move, andGreen where positive. We even have “no-trade” zones (White) when the MACD isn’t giving us a signal at all. Here’s an example:
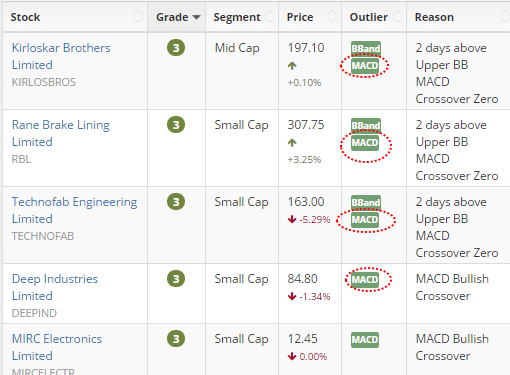
We also use MACD extensively in the Outliers part of Capital Mind Snap. Many of our outliers get secondary assistance from an MACD Bullish or Bearish crossover.
Note: Snap is currently in beta. Actually, alpha. We hope to have the full product over soon! But do check it out – as a member you get full access to the product and all features.
We hope you have enjoyed this lesson. Do give us your feedback at premium@capitalmind.in or if you’re a member, use the Premium discussion group.
Previous LearnTA Posts:
• Introduction to Technical Analysis
• The Momentum Oscillator called RSI
• Candlestick Patterns: The Doji, White Soldiers and Black Crows
• Pivot Points and their Range Implications
• Backtesting a Systematic Trading Strategy
• Introduction to Market Profile
![]()
Disclaimer
Nothing in this newsletter is financial advice and should not be construed as such. Please do not take trading decisions based solely on the matter above; if you do, it is entirely at your own risk without any liability to Capital Mind. This is educational or informational matter only, and is provided as an opinion.
Disclosure: The authors at Capital Mind have positions in the market and some of them may support or contradict the material given above, or may involve a direction derived from independent analysis.

[/level-capmind-pro]