How would you measure GDP Growth? By comparing it to last year. And when you get a GDP growth figure like 7.9% you always get up and say, wow! This is the fastest growing emerging market in the world! And it’s growing faster than it has in the past couple years:
Note: An earlier version of this post had used two-year-ago data that has apparently been further revised in some interim timeframe. We saw data revised all the way to 2011, which is not something that happens often, and we didn’t see that coming! We apologize for the error and have fixed the data here.

Awesome, you think. It’s always going to be the details that matter of course.
A note on past revisions.
GDP data isn’t accurate. It’s a guess. Today is May. You don’t know how much the GDP was last year for sure. You take a guess based on a lot of data points – companies that announce results, excise and custom duty collected, people’s TDS, and so on. But people will change that data – they will file tax returns in July. You will see excise and customs duty collection numbers change once people file returns. You will see data changed. So, when data changes they revise the past data.
The data isn’t adjusted a whole lot. It’s usually a small amount – because otherwise you weren’t guessing right at all. Last year, the GDP for March 2015 was reported first at a measly 6.1%. This has suddenly changed up to to 6.7% because – hold your breath – they have revised March 2014 data now. And this has seen changes for GDP growth back to 2012. In the interim, of course, we have had a base year change – from using “stable” prices of 2004-05, they moved to using stable prices of 2011-12 instead, and this has probably involved many more interim revisions.
Right now, we have seen data changed for the base year in Jan 2015. Then a revision of the past data has been seen in May 2015, then again in Sep 2015 and Feb 2016. And yet again now, when certain excel sheets on the MOSPI site (which releases the GDP data) has numbers we have never encountered before.
In general, the growth numbers have, as it turns out, remained the same. Numbers have been revised downwards in most years, and that has meant we get similar growth rates (though absolute numbers have changed)
In an earlier version of this post, our past data going back earlier than 2014 was expected to be unrevised – since MOSPI doesn’t revise data after two years, generally. So our graphs showed a lower growth rate for past years. After looking at all the revisions, we have noted that growth rates haven’t changed since all numbers are changed downwards going back. You may make your guesses on how convenient this seems to be, but we apologize for our error.)
Sectoral Growth : Good Show By Manufacturing But Data Totally Differs From IIP
Sectoral growth has changed hugely for manufacturing, Mining and Electricity (through that doesn’t seem to reflect as much in the IIP):
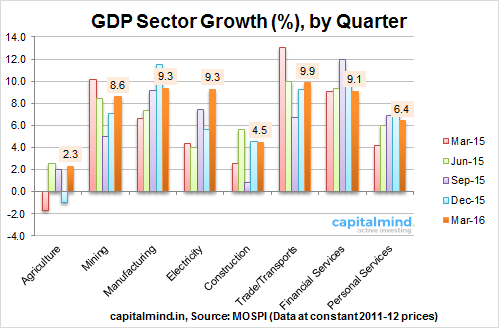
We’re seeing reduced activity in construction, and some minor slowdown in personal services.
Manufacturing at 9.3% is at a very strong level – this is real growth remember, not nominal. However, if this was true, we should have been seeing much higher IIP figures than the sub-5% levels that we seem to be seeing. IIP is made from three sectors – Manufacturing, Mining and Electricity. And IIP growth in March 2015 was a miserable 0.05%.
If the three above sectors are showing real growth (net of inflation) of 8.6% or more, in the above GDP data, then why is IIP so miserably low? Both track “real” growth (i.e. net of inflation) and are released by the same agency – MOSPI. How can they differ so much?
Data integrity questions remain. Manufacturing growth does look evident with pretty good results in much of the manufacturing sector in corporate results for March 2016. So it’s either the IIP that’s incorrect or the GDP, and let’s hope it’s the former.
We’re seeing personal services slow down a little bit and financial services growth taper. Financial service growth is unlikely to increase much more than the growth in credit, which is about 9.8% now.
And Components: Personal Expenditure Remains The Only Bastion of Growth
Trade’s gone off a cliff. Investments (Fixed capital formation) are now negative. Inventories are being used – so in reality what’s already been built has been used (in some mega macro kind of way). Government expenditure hasn’t moved much.

The number’s all about private consumption, and with the massive increase in taxes we are likely to see this under threat too. But of course, all we have to do when that happens, is to revise past data appropriately.
Government expenditure is likely to pick up, though, since the government is raking it in with new and higher taxes (service tax, income tax, dividend tax, excise duty on fuels etc). Private consumption might fall in terms of growth, but overall we will remain hugely dependent on it (it’s more than 60% of our GDP).
Trade has been lousy – and we have seen negative growth, or contraction, in exports and imports for the last five quarters. Our trade deficit is the lowest now for a long time. As this changes, and the economy improves, we are likely to see a deficit situation yet again which will impact GDP growth negatively.
Note: Livemint has an interesting piece on “Discrepancies” that seem to be driving growth. At Rs. 143,000 cr. the discrepancies – stuff they really don’t know where to put or what doesn’t add up – is the highest for a while. Without it, growth would be a miserable 3.9%. This is something to be noted – and probably accounts for the big discrepancy in IIP growth versus GDP growth.
GDP Inflation at 2.7%
The difference between nominal and real growth is the GDP Deflator. We use the figures mentioned by MOSPI to calculate this. Here’s how it’s come about – and at 2.7% is rising marginally, though it’s not in dangerous territory.

This is much lower again than the “inflation” we see – which is more than 5%. Much of this is because inflation measured as a consumer price index doesn’t apply to the economy as a whole. In any case, the prices used for calculation are at the wholesale level for the most part, which have not really been rising.
Contributions: Manufacturing, Trade and Financials
If you split the 7.5% (GVA) growth by parts, then the biggest impact to GDP was in the Trade/Transport growth, which gave us 2% of the whole number. 1.7% each was by Financial Services and Manufacturing.

Our View: Good Number, Diverges From Other Data Though
While the 7.9% number is good, we can’t figure out why it diverges so much from the IIP data, or from known inflation data either. However, this is the only comprehensive number we get. Please do note that these numbers are subject
to more revisions in the future.
Our earlier impression was that the numbers were built on past revisions. But now that data is revised all the way back to 2011, there’s not much of that argument remaining.
Assuming that these numbers are correct, we would say this is a very good growth number. The growth in manufacturing is especially encouraging, as it seems to indicate a revival in a long-ignored sector. A high growth figure is also visible on the back of lower inflation, and if inflation remains under control, we are likely to see smart growth continue. There is likely to be an increase in government expenditure (what else will they do with the higher taxes), and a slowdown in personal/financial services and personal expenditure, going forward. India will still be the fastest growing large economy for FY16: let’s hope to replicate that feat going forward.