
Today we present another report on the Indian Mutual Fund Industry. The data being presented is published by AMFI every quarter. Though we have covered other data releases by AMFI extensively, the one covered below here is part of new data series.
Accounts in the Industry
As of September, 2016 there are 5.05 crore accounts through which investments in Mutual Funds take place. Of this, 99% accounts are held by Individuals – both Retail at 94.91% and HNIs at 4.10% with Institutional Investors making investments from 0.04 crore accounts.

Since June-15 there have been 0.77 crore accounts added and since then, new account additions have increased by an avg. of 0.05 crore accounts or 5 lakh accounts every month and since Mar-14, accounts additions have remained positive.

Note: Account refers to a folio. An investor may have multiple accounts in a single fund or across funds. This is therefore not a count of number of investors, but number of accounts.
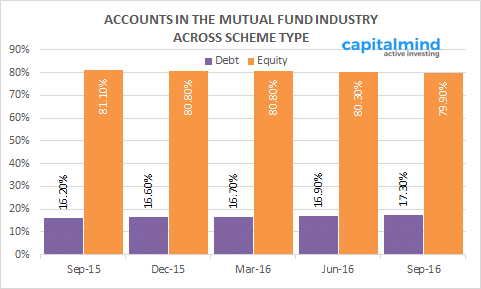
Accounts Across Scheme Types
Most of the accounts investing in Mutual Funds have remained concentrated in Equity Schemes which takes the lion’s share of investment at 80% – a constant number over the past 5 quarters or 15 months.
Average Industry Ticket Size
The average ticket size has always been higher for liquid and debt schemes which are dominated by Institutional Investors.

Growth in ticket size from Jun-16 to Sep-16 for Equity Schemes stood at Rs. 9,084/-, Debt Schemes at Rs. 51,975, Liquid Funds at Rs. 7.95 lakhs and ETFs at Rs. 47,860/-.
Over the past 5 quarters (Sep-15 to Sep-16)
- Equity Investments have increased from Rs. 1.17 lakhs to Rs. 1.29 lakhs
- Debt Investments have increased from Rs. 7.89 lakhs to Rs. 8.18 lakhs
- Liquid Investments have fallen to Rs. 50.66 lakhs from Rs. 52.83 lakhs
- ETF Investments have increased from Rs. 2.67 lakhs to Rs. 3.12 lakhs
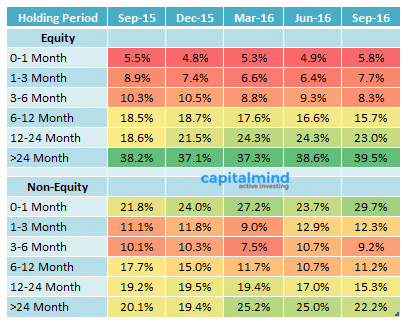
Holding period of Investments
- 40% of the Investments in Equity Schemes were held for more than 2 years while 30% of the Investments in Debt Schemes were held for lesser than 30 days.
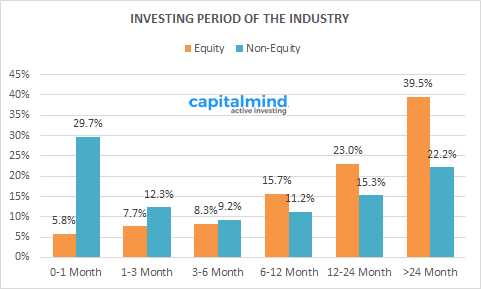
- In Sep-15, 22% of the Non-Equity Investments were held for lesser than 30 days. While in Sep-16, over 29.5% of the Non-Equity Investments are held for lesser than 30 days.
- Equity Assets being held for more than 12 months has seen an increasing trend from 18.6% to 23% since Sep-15. However, the trend reverses out for Equity Assets being held for 1-3 months (8.9% to 7.7%), 3-6 months (10.3% to 8.3%) and 6-12 months (18.5% to 15.70%) have all seen a decline in % of assets held.
Like it or hate it, do leave us with your reviews in the comment section below.