AMFI has started to disclose some additional data related to Mutual Fund investments from October, 2015. Today, we look at a snapshot of this data:
14.5 Lakh Crores in Mutual Funds Assets managed by the MF Industry has increased from Rs. 10.7 lakh crore in Oct-14 to Rs. 14.5 lakh crore in May-16 with Debt funds taking the most investment at 45 paise of every rupee invested.

Here is the chart clearing showing the domination of the Institutions while investing in Mutual Funds:
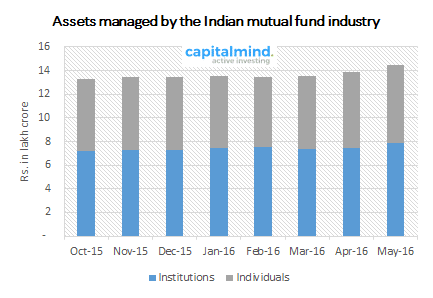
Institutions vs Individuals
- Investments by Individuals account for a little over 45% of the total assets while the remaining 55% is constituted by Institutions
- Investments from Individuals stands at Rs. 6.57 lakh crore for the month of May-16 compared to Rs. 5.63 lakh crore for the same month of previous year while investments from Institutions stands at Rs. 7.88 lakh crore for the month of May-16 compared to Rs. 6.62 lakh crore for the same month of previous year. That is Individuals are at least a year behind in terms of monetary investments in MF compared to Institutions.
- Investment amount has increased every month except for Mar-16 in case of Institutions which witnessed a Rs. 0.1 lakh crore drop while for Individuals it was in the month of Feb-16 – a drop of Rs. 0.15 lakh crore.
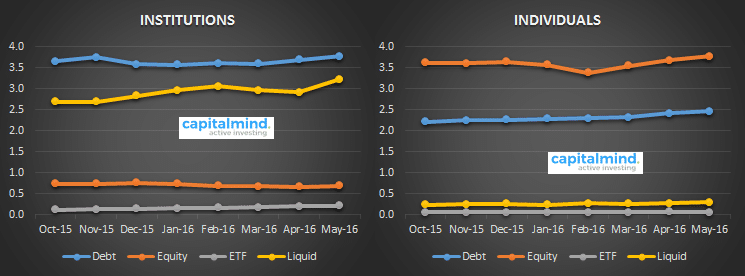
Scheme Wise Composition
While investments in liquid funds (Rs. 3.51 lakh crore assets) has only increased by 25% in May-16 compared to Oct-14 levels, ETF has commanded the highest increase at 62% though it has only Rs. 0.26 lakh crore worth assets followed by Equities at 48% (Rs. 4.45 lakh crore assets) and Debt Funds at 32% (Rs. 6.23 lakh crore assets). The EPFO investing through ETFs – started last year – would have made this change.
While Individual investors prefer equity over debt for investments, Institutions have preferred Debt over liquid funds.
Debt + Liquid funds account for a little below 90% of the assets for Institutions while for Individual Equity + Debt funds account for a little over 95% of the assets.
Here is how the investment decisions were spread across the different schemes between Individuals and Institutions: 
Here is the trend over the past 8 months:

B15/ T15 Mix
The top fifteen cities in India are marked as T15 for mutual fund investors – so if you’re in these cities, your investment is a T15 investment. B15 is everything else.
- Over 83% of the assets (Rs. 12.1 lakh crore) have come from Top 15 locations while the remaining 17% (Rs. 2.31 lakh crore) has come from non-T15 locations.
- T15 investors clearly love investing in Non-Equity funds when compared to Equity Funds. Their average investment in Equity Funds has been 72% of the assets (Rs. 8 lakh crore) while the non-T15 investors prefer a perfect weightage between equities and non-equities. This can be explained by the fact that most institutions and corporates are in T-15 locations (big cities).
- The B15 location coverage is actually falling – for both individuals and institutions. Individual ownership in B15 has fallen about 0.5% in terms of marketshare since last year.

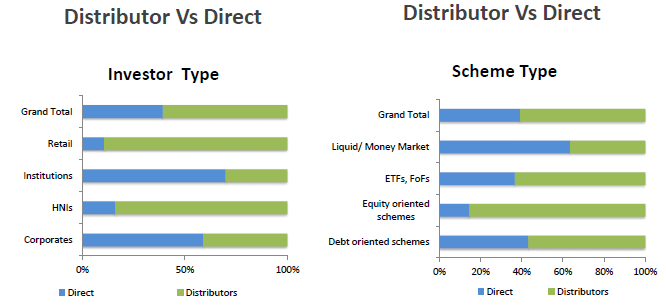
Distributors vs Direct
- 39% of the assets of the mutual fund industry came directly. This has been growing.
- 64% of liquid/ money market scheme assets where institutional investors dominate were direct, whereas 43% of debt oriented scheme assets were direct.
- Proportion of direct investment in equity to the total assets held by individual investors was about 5.6% in May 2016.
Individual-Investor Assets Composition
- 66% of the assets of Individual Investors are from T15 cities brought in by distributors.
- Direct investments amount to 14% of individual assets i.e. 3% from B15 and 11% from T15.

Source: AMFI -> Research & Information -> Other Data
![]()
Disclaimer
Nothing in this newsletter is financial advice and should not be construed as such. Please do not take trading decisions based solely on the matter above; if you do, it is entirely at your own risk without any liability to Capital Mind. This is educational or informational matter only, and is provided as an opinion.