 Assets managed by the MF Industry has increased from Rs. 14.89 lakh crore in Jun-16 to Rs. 15.73 lakh crore in July-16.
Not only it this the highest in over 20 months, but also the fastest growth in assets by 2 lakh crore in a period of just 4 months.

The bifurcation between Institutions and Individuals remains at 54.8% and 45.2% respectively.
Institutions vs Individuals: Neck and Neck
- Investments from Individuals stands at Rs. 7.10 lakh crore – up from Rs. 6.80 lakh crore in May-16, while Investments from Institutions stood at Rs. 8.62 lakh crore compared to Rs. 8.09 lakh crore in May-16.
- For the period Apr-Jul, Institutions have added Rs. 1.17 lakh crore while Individual investors have only been able to add Rs. 0.69 lakh crore.

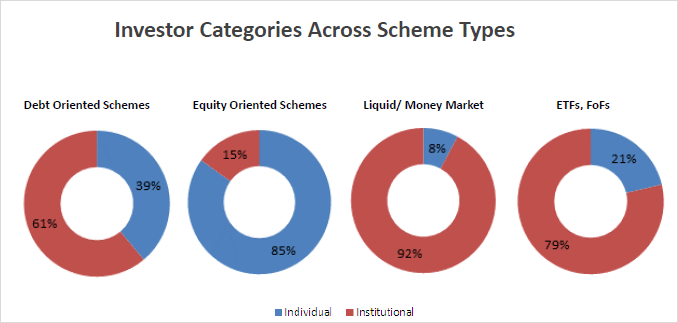
Scheme Wise Composition
Debt Schemes have seen the highest addition since Apr with Rs. 55,000 crore investment followed by Equity at Rs. 54,000 cr.

While Individual investors prefer equity over debt for investments, Institutions have preferred Debt over liquid funds.
Debt + Liquid funds account for a little below 90% of the assets for Institutions while for Individuals, Equity + Debt funds account for a little over 95% of the assets.
Here is how the investment decisions were spread across the different schemes between Individuals and Institutions:
B15/ T15 Mix
The top fifteen cities in India are marked as T15 for mutual fund investors – so if you’re in these cities, your investment is a T15 investment. B15 is everything else.
- B15 assets have grown from Rs. 2.24 lakh crore in Apr to Rs. 2.55 lakh crore in July and have remained consistently maintained a 50-50 investment ratio in Equities and Non Equities.
- T15 assets have shows a much better growth with the addition of Rs. 1.56 lakh crore from Rs. 11.61 lakh crore in Apr. T15 investors weigh more on the Non-Equities end with a 3:1 investment ratio. This is due to the presence of Institutions in this segment.

Distributors vs Direct – Direct Closing In, at 41%
- 41% of the assets or Rs. 6.45 lakh crore of the mutual fund industry came directly. This has been growing significantly since Oct-15 when it was around 36%.
- Equity investments are still controlled by the Distributors with 86% of the investments.

Individual-Investor Assets Composition
- 65% of the assets of Individual Investors are from T15 cities brought in by distributors.
- Direct investments amount to 14% of individual assets i.e. 3% from B15 and 11% from T15.

Assets Under Management contribution across India
Here is how the growth has been across each one with the most coming from the West i.e. Maharashtra. Also shown here is the contribution and growth from the top 5 states. Values in Rs. Crore.

AUM’s across India with the highest in green i.e. Maharashtra with most of the eastern part of the country at the bottom of the table.

Source: AMFI -> Research & Information -> Other Data
![]()
Disclaimer
Nothing in this newsletter is financial advice and should not be construed as such. Please do not take trading decisions based solely on the matter above; if you do, it is entirely at your own risk without any liability to Capital Mind. This is educational or informational matter only, and is provided as an opinion.


