
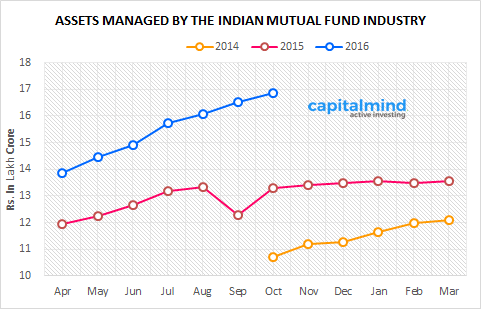
Assets managed by the MF Industry has increased from Rs. 16.51 lakh crore in Sep-16 to Rs. 16.85 lakh crore in Oct-16.
Sequential growth stood at 2.09% or Rs. 0.34 lakh crore compared to a 2.76% Rs. 0.35 lakh crore during the same period in the previous year.
Institutions vs Individuals
The composition between the Individual Investors and Institutional Investors has remained stable at around 45% and 55% respectively though both the groups have made massive new investments.
While Individual Investors fresh investment stood at Rs. 0.19 lakh crore in October last year, this year the number turned out to be Rs. 0.16 lakh crore. Same number for Institutional Investors stood at Rs. 0.16 lakh crore and 0.18 lakh crore.

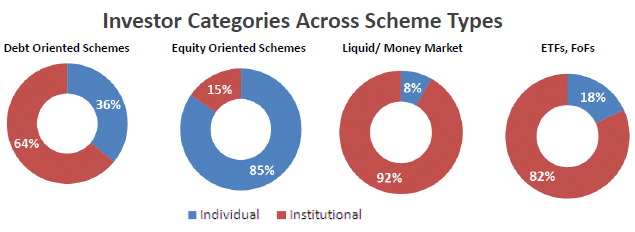
Scheme Wise Composition
Fresh investments in Debt stood at Rs. 0.38 lakh crore, Equity at Rs. 0.14 lakh crore and Liquid which witnessed withdrawal greater than invesmtents at Rs. 0.17 lakh crore.

Here is how the investment decisions were spread across the different schemes between Individuals and Institutions:
B15/ T15 Mix
The top fifteen cities in India are marked as T15 for mutual fund investors – so if you’re in these cities, your investment is a T15 investment. B15 is everything else.
- B15 assets have grown from Rs. 2.24 lakh crore in Apr-16 to Rs. 2.79 lakh crore in October – a growth of 22% or 0.55 lakh crore.
- T15 assets have grown at a lower rate from Rs. 11.61 lakh crore in Apr-16 to Rs. 14.06 lakh crore in October – a growth of 19% or 2.45 lakh crore.
Ratio of Investment in Equity and Non Equity between the B15 and T15 investors have remained at a constant ratio of 50:28 and 50:72 i.e. B15 and T15 Equity and B15 and T15 Non Equity.

Distributors vs Direct
- 41% of the assets or Rs. 6.91 lakh crore of the mutual fund industry came directly. Since Apr-16, Direct Investments have increased by Rs. 1.64 lakh crore or at 31%.
- Remaining 59% were derived from distributors i.e. 59% of the assets which have grown from Rs. 8.59 lakh crore in Apr-15 to Rs. 9.94 lakh crore – an increase of 1.35 lakh crore or at 16%.

Assets Under Management contribution across India
Here is how the AUM flow has changed across the 5 different zones in India.
- West Zone courtesy of Maharastra increased AUM by Rs. 15,000 crore, followed by North Zone at Rs. 9,500 crore.

Here is AUM for the top 4 states. All values in Rs. Crore.
- AUM in Maharastra increased by Rs. 14,700 crore while the remaining top 3 states added Rs. 3,700 crore.

Source: AMFI -> Research & Information -> Other Data


