
We bring you the “Monthly Mutual Fund Coverage” for the month of December, 2016. We take a look at the various Industry Trends, Mix between investments from Top 15 cities of India vs everyone else, Folio & Ticket Size of the Investments and an in depth look at how an Individual Investor invests. (Catch all the previous reports here).
Total Assets managed by the Indian Mutual Fund Industry
Assets managed by the Mutual Fund Industry increased from Rs. 16.94 lakh crore in Nov-16 to Rs. 17.06 lakh crore in Dec-16.

Institutions vs Individuals
Fresh investment from Individual Investors stood at Rs. 5,710 crore against Rs. 6,341 crore from Institutional Investors.

Value of assets held by Individual Investors witnessed a 26.46% YoY growth i.e. Rs. 356,941 crore.
Scheme Wise Composition
Fresh investments in Debt Funds stood at Rs. 0.02 lakh crore, Equity Funds witnessed a draw down by Rs. 0.05 lakh crore in similar lines with Liquid Funds at Rs. 0.05 lakh crore.

How were investment decisions spreads?
Institutional investors dominate liquid and money market schemes (93%), debt oriented schemes (64%) and ETF’s, FOFs 84%). oriented schemes (64%) and ETF’s, FOFs 84%).
Equity Equity oriented schemes derived 84% of their assets from individual investors i.e. Retail and HNI.

B15/ T15 Mix
The top fifteen cities in India are marked as T15 for mutual fund investors – so if you’re in these cities, your investment is a T15 investment. B15 is everything else.
- B15 assets have grown from Rs. 2.55 lakh crore in Apr-16 to Rs. 2.85 lakh crore in December – a growth of 27% or 0.61 lakh crore.
- T15 assets have grown at a lower rate from Rs. 11.61 lakh crore in Apr-16 to Rs. 14.20 lakh crore in December – a growth of 22% or 2.59 lakh crore.

About 25% of assets assets held by individual investors is from B15 locations. About 10 % of institutional assets from B15 location. Institutional assets are concentrated in T15 locations.
65% of the assets of Individual investors are from T15 cities brought by distributors. Direct investments amount to 12% of individual assets.
Distributors vs Direct

- About 8% of the retail investors chose to invest directly while 16% of HNI assets were invested directly.
Account Across Investor Types
There are 52,820,155 accounts in the mutual fund industry as at December of which 99% is accounted for by individual investors.

Retail Investors lead with 499 lakh accounts followed by HNI at 23 lakh account and Institutional Investors at 5.38 lakh account.

Accounts Across Scheme Types
Equity and Equity Oriented Schemes still dominates with 80% accounts while Liquid and Money market funds account for less than a 1%.

Average Ticket Size
Avg. ticket size fell by Rs. 3,306 to Rs. 1.26 lakh across Equity Schemes while Debt Funds witnessed an increase of Rs. 29,721.
Overall the average ticket size fell by lesser than Rs. 1,000 to Rs. 3.11 lakh from Rs. 3.12 lakh.

Retail Investors’ Average Account Size
Institutional investors including FIIs had the largest ticket size at Rs. 10.22 cr per account. Retail investors had an average ticket size of Rs. 68,086 per account, while HNIs held while HNIs held 18.68 lakh per account.

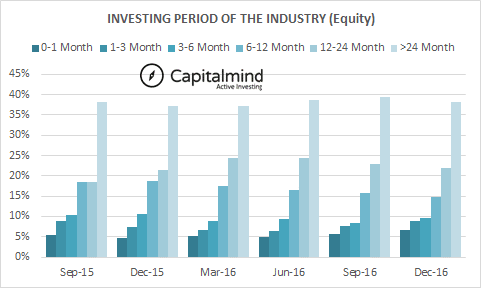
Investment Period
Equity assets have a longer average holding period as compared to non Equity assets. 38% of equity assets have been held for periods greater than 24 months.

Here is how the trend has been for the past 5 quarters:

Source: AMFI -> Research & Information -> Other Data
Love it or hate it, do leave us with your reviews in the comment section below!


