How often do you hear this: Only 40 days have contributed to the total gains of the S&P index since inception! So, missing those days can have a massive impact on your portfolio! This theory is pushed to showcase the advantage of staying in stocks all the time regardless of market conditions and sentiments.
The saying goes: Time in the markets is more important than timing the market. But Timing is often confused with buying at the troughs and selling at the peak. Buying quality business when it’s cheap and selling off when they are expensive is another way of timing too.
One of the ways by which it’s shown that timing is not possible is by showcasing how missing just a few days, say the best 25 days of the market, can harm the portfolio irreversibly. So, how do we check which are the best 25 days of the market since Inception of the Index?
Most analysts who come up with such reports create charts by removing the biggest point gainers and claiming that only x days accounted for all the market growth. But since an Index always has an upward trajectory, this is wrong. Instead, one should remove only the days with highest percentage change.
What if you removed the Top 25 Winning Days?
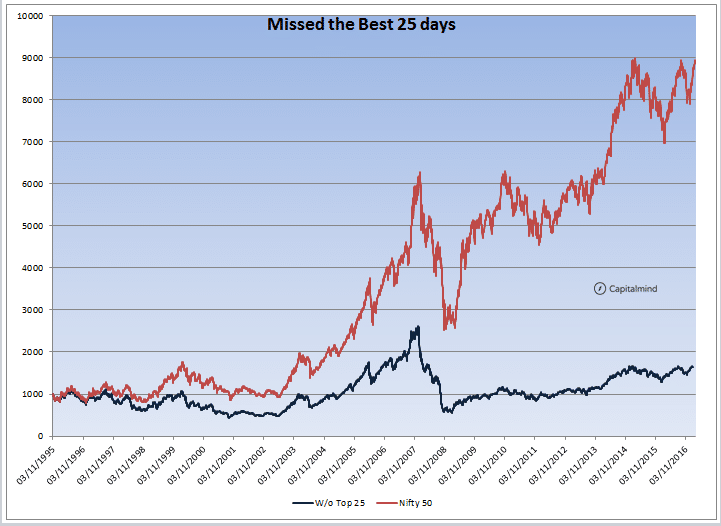
Removing the Top 25 winning days reduced total Nifty change by 92%. While the Nifty itself went from 1000 to 9000, missing the top 25 winning days means your Rs. 1000 would only grow to less than Rs. 2000 in over 20 years. That’s less than 4% returns. What this shows is that it’s imperative that we are invested in days when the market moves big. If one stays out of these monster moves, the resultant tracking error is so large to make returns look meaningless.
Even Smarter: Sell Before Horrible Days
But what if we were somehow able to sell the day before the days when Nifty had its worst performance. Swinging 180 Degrees from the previous concept, how about if we removed just the worst losers.

What a change missing out on the Bottom 25 makes for the equity curve! The out performance is just humongous. Rs. 1000 invested in the Nifty went to Rs. 9000, but if you just missed the bottom 25 days (sold the day before, and bought back on that day’s close), you would have gone to Rs. 54,669.
What if one missed both the Best 25 days and also the Worst 25 days?

Missing both would still enable us to beat the Nifty returns but by a slender margin of 14%. Since we cannot predict big moves, how do we reduce the risk of drawdowns when markets take a deep dives once in a while?
Instead of Days, How about Months?
All the above data is based on missing a few days, but what if we missed a entire year, but not in the way we treat a year but as in missing the 12 crucial months that matter?
If one ignored the Best 12 months, Nifty would still be trading at 1819 (starting base of 1000). In other words, just 12 months of gains have contributed immensely to the total returns of the Index
On the other hand, if you missed out on the worst 12 months, Nifty would be trading at a mind boggling 66,900. That is what missing out on the bad months alone would have added in terms of Alpha.
But, given that we don’t have a friend like Doctor Emmett Brown [Movie: Back to the the Future] who will build a machine that can transport us into the future and then get to know the months or days we need to avoid. So, how does the above data be of any help?
The Momentum Factor
No strategy or model can be created which participates in the big up moves while always being out of the market during the big falls. But as the data above showcases, its not missing out on the big rise that is a big issue, its about how one can outperform by missing out on the bad days.
While we don’t know when markets can drop sharply, our biggest worry and the cause for most lower returns by most investors, we do have a few clues. For example, while not a predictor of big moves, the probability of a major bearish move is very high when the markets are trending below the 200 day EMA than when its trending above.
The very underlying concept of trend following / momentum is to be with the trend and hence be able to capitalize when big moves come up. On the other hand, big down days never happen at the start of a bear market (the worst month was October 2008 by which time markets had already fallen significantly). This means that anyone who follows a model which can avoid the worst while able to participate in as many of the best moves as possible will ultimately end up with a return that is greater than what can be achieved by purely buy and hold.
Of course, there are costs to any strategy and one needs to consider that since any out-performance of the strategy can be ruined if there are way too many trades.
For some one who doesn’t want to actively trade the market and hence unable to sit with a momentum portfolio, the next best choice would be a asset allocation with regular re-balancing. While this doesn’t help avoid the bad days, a dynamic asset allocation can allow a investor to be out perform the benchmarks without being catching either the top or the bottoms.
The only risk free returns one can generate would be from treasury bonds, everything else carries a risk. As long as one understands the factors behind those risks and ways by which some of those risks can be mitigated, returns would ensue.