As part of our taking stock series started in 2017, in this post we analyze JM Financial Ltd.– leading Financial services and Asset Reconstruction company in the country.

JM Financials which today is one of India’s leading Investment Bank started its journey in 1973 when JM Financial Group forayed into the financial sector services as JM Financial & Investment Consultancy Services Pvt. Ltd. Over the last 45 years, the company has achieve many distinctions such as being the first company to introduce fully convertible debentures, equity warrants and Deep discount bonds in Indian Capital Markets. When SEBI introduced the concept of Book Building in Initial Public Offers, JM was the Investment Bank which came out with the first such issue.
Nimesh Kampani, the founder of JM Financials is a Chartered Accountant by Profession. JM came out with a Public Issue in 1992. In 2006, he stepped down in favor of his son, Vishal Kampani while he continues to be the Chairman of the company. A notable name in the Board of Director is Dr. Vijay Kelkar who was previously the Finance Secretary in the Government of India and is also a Director at National Institute of Public Finance and Policy, a research institution in public economics and policies.
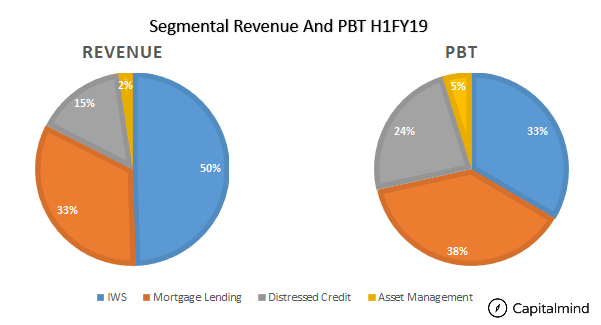
JM Operates in multiple businesses and operates each through a subsidiary which results in JM being a holding company of a clutch of subsidiaries. Almost all the subsidiaries accounts are for various business that form part of Investment Banking, Wealth Management and Securities which accounts for 50% of the total revenues.
Below is the operating structure of subsidiaries of JM Financials.


JM financial over a period has evolved and slowly streamlined its subsidiaries mainly under four sub headings as
- Investment Banking, Wealth Management and Securities segment (IWS);
- Mortgage Lending segment;
- Distressed Assets segment and
- Asset Management.
We will discuss the individual segments as below.
Investment Banking, Wealth Management and Securities
The IWS segment involves two divisions viz. fund based and fee based. Fund based activities include lending to capital market in terms of margin funding IPO financing etc.
Fee based involves broking business, advisory fees on wealth management, M&A commissions etc.
IWS is a major revenue generating factor for JM with 50% of revenue and 33% of profit coming from the segment. The IWS division can be split into Investment Banking, Wealth Management and Securities.
Investment Banking.
Investment banking include deal closures, book running lead manger, IPO financing etc. This business vertical is not a continuous revenue generating affair, because it depends on market sentiments and deal availability. JM charges a one time fee for each individual deal.
This generates Rs 250 Cr worth of revenue on a yearly basis. The segment is more dependent on mergers and acquisitions and IPO activities. In last year JM were lead managers for HDFC Asset Mangement, L&T Technology Service, L& T Infotech. Additonally, they were manager to the TCS buyback. On M&A deals JM managed to close deals for Reliance Jio and RCOM, Timken and ABC bearings, JSW steels and Monnet Ispat etc.
Wealth Management
Wealth management is primarily advisory services through which they generate fee income. JM financials acquires large HNI clients and then guides them through their investments according to individual risk patterns. In many cases, the clients are promoters of some firms or are into family owned business. JM financials charges a fixed fee on AUM of individual client.
Currently JM financials is managing an AUM of Rs 43,941 Crs, an increase of 30% YoY.

The AUM size shot up post FY18 end by 35%. This is largely on account of addition of large clients.
Wealth Management AUM has grown at the rate of 10.45% CAGR for last six quarters. The AUM growth is also dependent on market conditions as bullish markets attract more clients into the investing world.
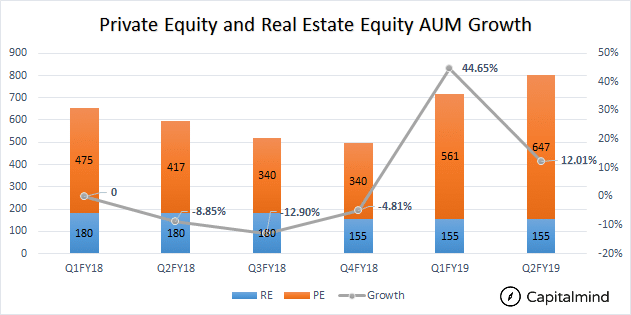
Apart from that, JM is also involved in private equity and real estate investments of private clients. The growth here has stagnaed since the start of FY18. One reason attributable to that is equity market has slowly tapered down post long term capital gains tax, and a lot of real estate deals have seen stagnation post demonetisation.
Securities
The securities business has two verticals:
- margin funding (fund based) – JM Financial Capital
- broking (fee based) – JM Financial Services
Both verticals are impacted by market sentiment.
The tenure for margin funding varies from 30-90 days. For the margin funding, money is raised from the CP market. Current capital market exposure of the lending book is at Rs 3,500 Crs. As there was liquidity tightening in CP market, the cost of funds has gone up by 50-100 basis points, but this has not been passed on to customers. An increase in margin costs scares away margin traders.
The broking business has very little funding needs. The average daily turnover for second quarter of FY19 was at 6046 Crs, which is a growth of 27%.
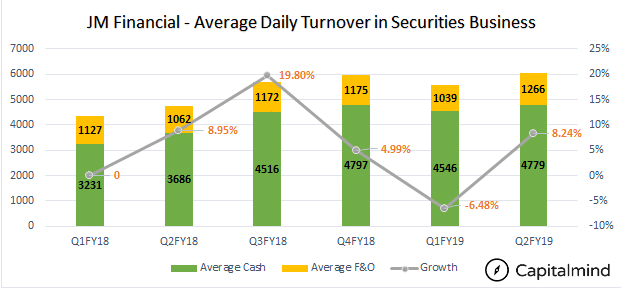
If we consider as % of total transactions on NSE, JM financial forms a tiny 0.57% of the turnover. However its cash based broking business is good with a market share of 3.32%.

Most of the broking business comes from midcap companies.
At the peak of markets broking business was sitting on a cash pile of 200-225 Crs. This could have been returned to the parent company by means of dividend. But doing that means dividend distribution tax and income tax, so they would take a 30% hit.
Rather than doing that, JM financial took RBI approval and started a new NBFC with this 225 cr. to fund its capital market lending. (This is why the capital market lending is in a different company from the other lending arms)
Mortgage Lending
Mortgage lending has been the main business of JM, which generates 38% of PBT. They primarily give developer loans (Wholesale loans) to builders. Apart from that, Mortgage lending includes corporate lending and retail lending (home loans, SME loans, educational institution loans etc.)
Top 30% of borrowers consists of 10 big borrowers. The names include:
- RMZ (500 Cr +, Bangalore),
- Adarsh (500 Cr +, Bangalore),
- Embassy(500 Cr +, Bangalore),
- Divyashree(500 Cr +, Bangalore),
- Kalpatru (490 Cr, Mumbai),
- Casa Grande (< 400 Cr, Chennai),
- Goel Ganga (< 400 Cr, Pune),
- SPR (< 400 Cr, Chennai),
- Spanta (< 400 Cr, Mumbai) and
- Neelkanth (< 400 Cr, Mumbai).
In terms of quality, these are Tier 1 or Tier 2 builders.
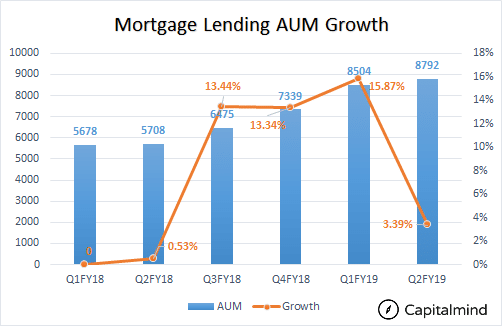
JM financials have given a guideline of 20% growth in loan book in optimal conditions and 25-30% in conducive environment and 10-15% if conditions are not favorable.
Asset Management
Asset Management involves the mutual fund business. JM financial was the first one to start a private mutual fund in India way back in 1994. But over the years, they have lost their sheen and don’t figure in the top 10 mutual funds in the country.

In early 2000’s JM Financials started private equity and real estate business, which has not grown significantly since then.
Lately the AUM growth has stagnated. Currently asset management generates 2% of consolidated revenue and 5% of PBT.
Distressed assets: The Asset Reconstruction Business
Post 2008, JM financial bought a lot of distressed firms which generated an IRR of 30-40% with a turnaround time of 4-5 years. Then business stopped for couple of years as there were fewer companies to buy out at discounted prices. Then the banks NPAs started and there was again abundance of companies to buy out.
Before digging deep, we need to understand how ARC works.
Firms borrow from a bank by putting assets as collateral. In case firm is not able to pay, banks classifies it as NPA and starts recovery process. If the banks are unable to recover the outstanding amount, then they sell it to an ARC at a discounted price. (Say a Rs. 100 cr. loan sold at Rs. 40 cr.)
The ARC restructures it and then sells it, generating profits. Nowadays, we also see that ARCs don’t pay the full amount of money, and instead issue “Security Receipts” – which can be bought by the selling bank or third party investors, who then will be paid as the asset is recovered.
For FY18 distressed assets acquired were of value Rs 32,349 crs at a cost of Rs 14,761 Crs. Out of 14,761 Crs, 12,965 Cr security receipts were subscribed and the rest were held by minority interest in JMFARC. (An ARC has to own some SRs on its own book – that’s like skin in the game)
JMFARC subscribed SRs to the tune of 1,987 Crs and the rest was subscribed by private investors. Until the recovery happens JMFARC charges management fee for the underlying AUM. Once the recovery happens, SR receipt holders and minority interest are paid a proportional amount.
Generating money out of ARC can be done in three ways.
Restructuring
In restructuring the distressed assets will be given necessary support to bring them back to a healthy state. This can be done by financing its working capital requirement, re-strategizing the firms policies, weeding out the plagued assets etc. Once they are back into healthy shape, the assets are sold to acquirer. Restructuring takes more time but generates a higher return for JM financials. Out of the current lot 69% of the AUM are to be restructured.
In some cases JM financials retains a small stake if the firm appears to have growth story in a longer run. For instance JM held back 29% equity stake in Nitco post restructuring in the previous quarter, and will gain if their shares recover in price.

Asset Sale
Asset Sale involves acquiring distressed firms and splitting their assets into different verticals and then selling them individually. This works on principle that sum of the parts is greater than the whole. This strategy has lower turnaround time but has lower IRR compared to restructuring. Currently JM is planning to churn 25% of its AUM with asset sales.
Settlement
This is the least sought after strategy by asset reconstruction companies. Settlement is were you have bought a distressed asset, where in you are not able to do a turnaround story nor liquidate the assets. The only option is to negotiate a deal with promoters of distressed firms for a final settlement.
Turnaround time is very fast (provided deal goes through), the return is very minimal.
Distressed Asset Funding
To buy out distressed asset JM requires funding. The major funding comes by the means of NCDs (51%) and CPs (22%).
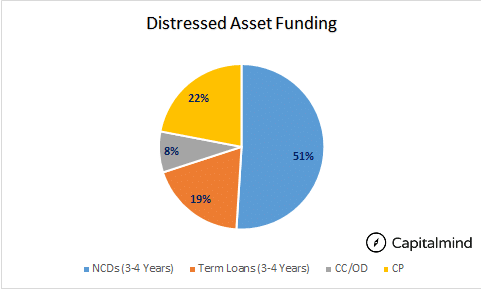
Using CP for funding distressed asset is not a suitable choice, but JM states that they use CP funding only for firms which are going to be resolved in shorter time (less than six months). This can be a risk: no one can predict how loan an asset can take to be recovered.
According to management even if 50% of distressed assets are resolved (out of the planned) in next six months, then JM will be sitting on a cash surplus in ARC business.
JM financial have set an internal gearing limit of 3.0x. At current juncture JM ARC gearing stands at 1.41.
Since 2014 the distressed asset AUM has grown at a CAGR 0f 27%. The AUM has went up nearly 5 times in last six years.
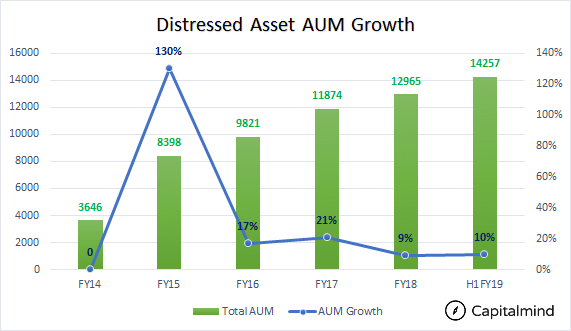
However, recoveries have been slow. Since the start of business in 2008-09, recoveries are to the tune of Rs 3,510 Cr. In last four years recoveries grew by 15.24%. Things will change going forward with the new bankruptcy law in place. Resolutions should help JM recover money faster.
Out of current 14,257 Crs, JM ARCs share stands at 22.53%. And for the rest of AUM, JM charges management fee.

In earlier cases banks were using 15:85 formula, where in 15% of the deal ARCs should have paid in cash and rest on a term plan basis.
With increasing pressure on banks to clean up their NPAs, they have moved to full cash mode. This still involves JM selling the rest to other investors. The cash and carry system provides more discounts for ARC, as most of banks have provisioned for the losses up to certain extent and ready to offer deep discounts to cut clean of the account.
A Look At JMF ARC Distressed Asset Portfolio.
Hotel Leela Ventures
Hotel Leela Ventures was assigned to JMF ARC by a consortium of banks, after the group failed to address corporate debt restructuring mechanism in 2014. JMFARC holds 26% stake in Hotel Leela ventures. Hotel Leela Ventures has an outstanding debt of nearly Rs 3,800 Crs.
According to some estimates the company is valued at Rs 5,000 Cr considering its prime hotels in Tier 1 cities. At current juncture, JMF ARC are trying to bring on a board Brookfield Asset Management, which will do the necessary turnaround and restructuring. JMF ARC plans to hold at least 10% stake after it brings Brookfield on board.
Bombay Rayon Fashions
JMF ARC bought Bombay Rayon Fashions from SBI for a sum of Rs 900 Crs in 2018. SBIs exposure to Bombay Rayon was Rs 2,261 Crs. SBI took a 60% haircut as it had already provisioned enough for its NPA.
Out of Rs 900 Crs, 840 Crs was paid in terms of cash and rest by way of security receipts. Bombay Rayon has still another Rs 300 Crs of outstanding loans left, which was provided by four banks.
Essentially if JM ARC can recover more than 900 cr. from Bombay Rayon, it makes a profit.
Unitech
JMF ARC bought HDFC loans to Unitech for Rs 869 Crs in 2016. As part of the deal JMF ARC paid Rs 155 Cr upfront and issued Rs 714 Cr worth of security receipts. Unitech is a construction which was headquartered in Guragaon. It has land in prime locations and has many half completed projects. Unitech at the end of FY17 owed Rs 7,800 Cr to home buyers and Rs 6,733 Cr debt. JMF ARC provided another Rs 200 Cr funding to revive distressed assets.
Alok Industries
JMF ARC and Reliance Industries have partnered together to buy bankrupt Alok Industries. Alok Industries owes a sum of Rs 29,500 Crs to a consortium of banks. JMF ARC and Reliance had bid for Rs 5,050 Crs – an 83% haircut for banks. Banks also went ahead and approved the resolution with 71% votes. However, a final decision is awaited.
The above are few of the top names which are in public domain.
Lending Profile
JM Financials lending book compromises four divisions viz. wholesale, capital markets, corporate and retail. JM Financials total lending book stands at 17,108 Crs and has grown 38% YoY. The lending book has grown at a CAGR of 5.93% on quarterly basis for last six quarter.

Nearly 65.53% of the lending book is wholesale (mainly developers), which is growing at the rate of 46% YoY. Corporate book share stands at 17.40%, Capital market book share at 14.45% and rest by retail mortgage.

80% of corporate loan book is given to BSE 200 firms. BSE100 firms have 50% share in JMs corporate lending book. Meaning the risk is too little, unless something like Vakrangee event happens. And even though if it happens, it will be a small impact considering total size of lending book.
Gross NPA and SMA-2
Currently Gross NPA are at 0.5% and SMA level of 1.4%. Though the numbers look well within range, but SMA level has shot up from 0.7% in Q1FY19. Typically, SMA means borrowers who have not serviced their loans for last 60 days but not exceeded 90 days. So these are the loans which are going to be converted to NPAs of not serviced for 90 days.

According to JM financial volatility on SMA levels is mainly on account of delay in construction progress by builders. Typically home buyers pays the developer on time but if construction has not been completed to certain level the money goes and sits in escrow account. Once construction gets completed to that level than money gets credited to account and account moves out from SMA. The company might in some cases refinance the loans to move it out of NPA/SMA stature.
The internal red flag for JM Financial is NPA > 1.5% and SMA > 4%. If the ratios breach internal benchmark, then things will turn worrisome.
Net Interest Margins, Cost of Funds and Capital Adequacy.
At the end of half year FY19, net interest margin (NIM) of JM lending book stood at 5.90%, which is a decline of 120 bps compared to Q1FY18. Cost of funds have gone up from 8.80% in Q1FY18 to 9.00% in Q2FY19, which is a increase of 20 bps. The below chart clearly shows JM is not able to pass on the rising interest rate to its customers.
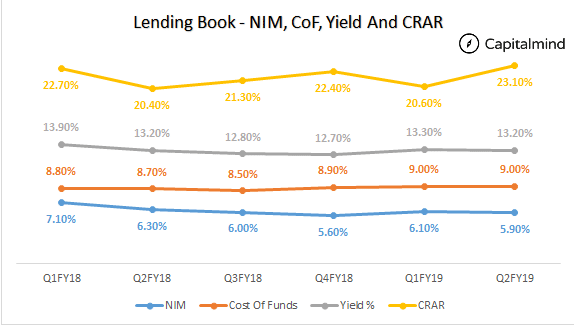
In terms of Capital adequacy, JM had dipped from 22.70% in Q1FY18 to 20.60% in Q1FY19. JM raised capital in two tranches in last six quarters. In Jan 2018, it raised 650 Cr via QIP and again in Sep 2018 wherein GIC, a sovereign wealth fund established by the Government of Singapore and Vikram Pandit together invested Rs 430 Cr. This has brought Capital Adequacy Ratio to 23.10%.
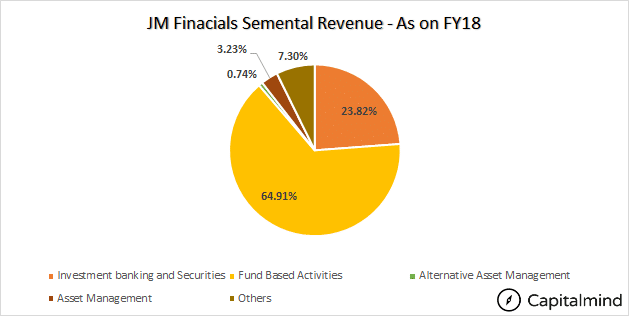
Revenue
After FY18 the segmental classification of business verticals have changed. A part (capital market lending) of fund based activities is been allocated to Investment banking , Wealth Management and Securities (IWS). IPO activities and deal closures used to come under other categories and now it has been moved to IWS segment. At the end of FY18, fund based activities generated 65% of consolidated revenue. Another 24% was from Investment Banking and Securities division.
JM financials revenue at the end of H1FY19 was at Rs 1,828 Crs. A growth of 21.9% YoY. Revenue has grown at a CAGR of 24% over a period of last five and half years.
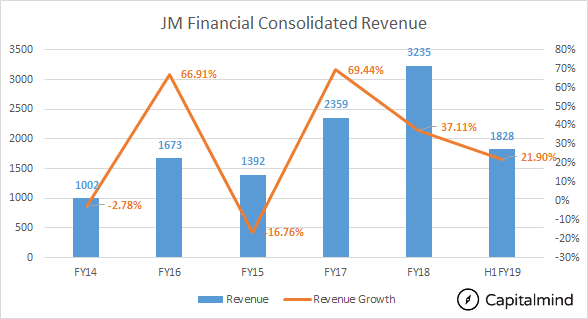
Growth slumped in FY15 due to lower revenue from asset management and investment banking division. Also the ARC business slowed down due to lower recoveries.
Management has stated if environment is conducive they can achieve a top line growth of 25-30% and if optimum, then 15-20% and not favourable than 10-15%. Future revenue growth depends on JMs lending books and its ARC recoveries, where a high return can be expected in next two years.
Net profit
JM revenue and profits are based on market sentiments. While it has been able to grow significantly in good years, they have seen a dip in growth when markets turned bearish. Going forward, Asset Reconstruction should add significantly to the bottom line and remove the overhang financials face from the constant bull and bear moves in the market.
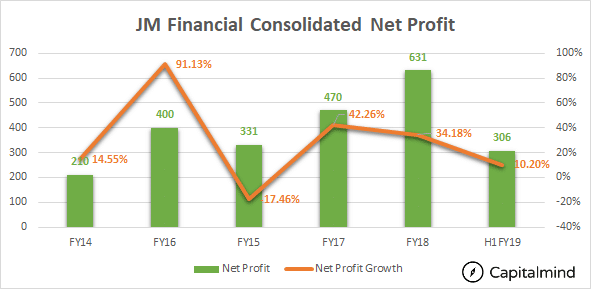
Profits have grown at a CAGR of 20% over a period of 5.5 years. 
Borrowing Pattern
JM financials borrowing needs have gone up in line with its increased lending activity. At the end of last year JM has outstanding borrowings of Rs 12,292 Crs. Out of this, nearly 60% has been through long term borrowings.
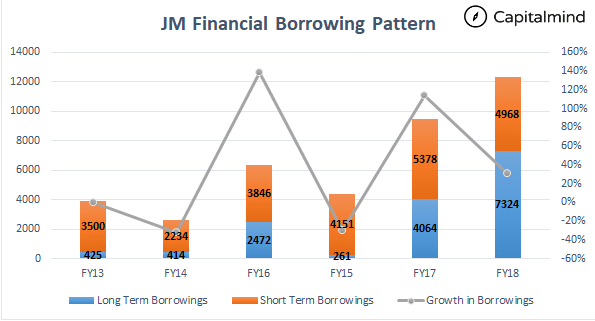
36% of funding came form NCDs and another 37% from CP market, 23% from term loans and rest from other sources.
JM Financials Fund Raising – 2018
- JM Financial ARC did a rights issue to the tune of Rs 280 Cr in Feb 2018.
- JM Financial raised 650 Cr though QIP in Feb 2018.
- JM Financial Credit Solutions issued secured NCDs if Rs 750 Cr in May 2018.
- JM Financial Credit solutions raised Rs 875 Cr via issuing fresh equity in Sep 2018
Finance Costs
Finance cost has been in line with borrowing pattern, lately finance cost has increased slightly on account of increased of cost of funding. Since JM isn’t able to pass on the same to its customer, any change in Interest rate on the upside is negative. Finance cost account for 50% of the EBITDA as the main line of business for JM is been lending.

Impact of Polices and Events on JM Financials
Slow Down In Realty Sector.
Real Estate financing accounted for nearly 62% of the loan book. With the real estate sector facing strong headwinds, JM Financial can be at risk if one of its major borrowers decides to default on their financial commitment. To reduce such risks, JM financial has classified its realty borrowers in Tier 1, Tier 2, Tier 3 and Tier 3. Tier 1 companies are large developers with 20+ years of experience and have sold millions square feet of build up property. Tier 2 is a mid size developer with 20+ years of experience. Tier 3 and 4 are developers having less than 10 years of experience and with lower brand profile.
JM financials loan book consists of 50% which are Tier 1 with the rest being Tier 2. Tier 2 margins are slightly better by 100-200 basis points compared to Tier 1. Smaller developers are generally the first to feel the crunch of weakness in Real Estate though as we have seen in North India, over extended large developers are susceptible to failure as well. Embassy, a large builder is looking at launch of India’s first Real Estate Investment Trust (REIT) and the success of this can have a impact on how large developers monetize their assets.
Implementation of Bankruptcy Code
Implementation of Bankruptcy Code has brought more cheers to the banking community and asset reconstruction community. It used to take typically 4-5 years for a company to get dissolved, with the new law in place, this has been cut down to 2-3 years. A faster resolution also means a better price for the asset sold.
Hike In Interest Rates
Higher interest rates is a negative factor when it comes to their IWS and Asset management division. Higher interest rates will also mean shift of funds from equity to debt and thus impacting their overall operating margin.
Change in Total Expense Ratio by SEBI
The recent change in TER for mutual funds by SEBI has hit the mutual funds across board. The extent of impact has varied fund to fund. In case of JM financials, the impact has been of 10-15 Cr for one quarter. On an annual basis the impact would be roughly 45-50 Crs.
Liquidity Crisis In CP Markets
After IL&FS default and liquidity crisis in CP market most of NBFCs have felt the heat. Either they are raising money at higher rates or converting short term loans into longer term. The problem area always has been long term projects (devleper loans) financed by short term borrowing (CP). In earlier cases NBFCs used to rollover, but the current tightening situation has left most of NBFCs running to banks.
JM Financial as on October 25th 2018 has 4,961 Cr of outstanding CP. Post Sep 30, 2018 JM has paid back CP around Rs 1800 Cr and new CP around 500 Crs. Post the CP repayment the debt/equity ratio came down from 2.6x to 2.3x.
Using CP for capital market, trading and broking business is justifiable and to some extent corporate lending can also be given levy. But Using CP for wholesale lending and distressed asset is cause of worry.
Out of the total CP issues 28% has been used for corporate lending and 27% to capital markets. 20% is for wholesale lending and rest is split between ARC and securities business.

8.6% of wholesale lending book is raised from CP market. And nearly 50% if corporate lending book. The longer-term corporate loans are a bit of concern. JM has stated that there is no liquidity problem for them as they have raised money in a recent round of QIP. Though they agreed that liquidity problem do exist in industry and might continue for another couple of months.
Self Imposed Limits
JM financial has imposed a limit of debt to equity ration of 3.75x for its lending business. Once it reaches that level the lending business will be stopped until fresh money is raised from the market. That’s the reason lending growth saw a slump in last quarter when debt to equity ratio hit the self imposed ceiling at the end of last fiscal. Post the CP repayments, debt to equity ratio of 2.3x, giving sufficient head room for further growth.
JM financial has also put a internal limit of maximum Rs 150 Cr exposure to single client from a single subsidiary. If the firm wants to borrow more than Rs 250 Crs, it needs to first exhaust limit of Rs 150 Crs in JM financial credit solutions and rest 100 it can borrow from JM financial capital.
Vikram Pandit’s Investment.
Vikram Pandit was the CEO of Citibank during the US Financial Crisis. He has bought 3% stake in JM financials and 50% in its subsidiary JM financial credit solutions. Pandit invested Rs 500 Cr in NBFC segment JM Financial credit way back in 2013. Pandit and his partner Hari Aiyar bought 3% by the way of warrants. And this was not the first time Vikram Pandit has invested in JM Financials, in a earlier instance of 2006, Pandits hedge fund Old Lane was lead investor and co -sponsor of JM Financial India Fund.
Our View
JM is an NBFC where the bet lies primarily in the ARC business, in the near term. The mortgage lending business has risks – because it lends to Real Estate Developers, and there is a stagnation in that space. However, the execution capabilities of the Kampanis over the last few decades provides some confidence that they will be able to deal with extreme situations in the business. Their average borrowing costs have risen to 10% recently, and they tend to lend at 18%+.
At the current price, JM trades at about 11 times earnings. If the debt markets ease up, we should see this stock continue to grow – it has grown at 20% CAGR in the past. The NBFC is a high-risk and potentially high-reward play for the medium term. (This is however not a recommendation).
Disclosure: Capitalmind and the authors may have an interest in the stock.
![]()
NOTE: As a disclosure some Capitalmind authors may own the above company in their stock portfolios. There is no other relationship between Capitalmind and the above company. Please do not consider this article as a recommendation, It is purely for informative purpose only.
Foot Notes
Our Premium Long Term Portfolio is at https://premium.capitalmind.in/
Our Premium Momentum Portfolio 2.1 is at https://premium.capitalmind.in/
Our Premium DivYield Portfolio is at https://premium.capitalmind.in/capital-mind-premium-divyield-portfolio/
Our Premium EV Portfolio is at https://premium.capitalmind.in/capitalmind-ev-portfolio/