
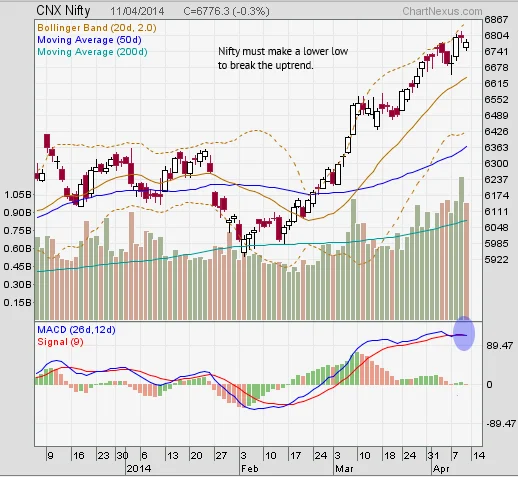
Charts: The Worst Month for the Nifty Junior in 10 years
Thanks to the turmoil in stocks, we’ve seen a massacre on the Nifty Next 50 (called the Nifty Junior) which fell 12% in the month. The index itself is down over 11% in 2018.

And since then, we’ve seen a Bandhan Bank drop another 20% (it’s in that index)
The Nifty fell too, a big 6% down month, but here have been bigger months in 2016 and 2015.

The idea that markets are benign and supposed to trade in nice ranges and keep going up - this is fairly new. It’s just showed us how bad things can get on the other side as well.
More volatility is coming our way, surely, but this chart helps to establish context compared to the past.
Tagged:Monthly returns