
IIP up 7.3% for March 2011
Big IIP move today, coming in at 7.33%. Again, highly unreliable data so it’s not something you should take action on. The past revisions have also been minor (just 0.2 to 0.3 on the index levels) which is not newsworthy.

Mining came in at 0.21%, the lowest since Feb 2009. Manufacturing was strong at 7.90%, the highest since October 2010 (which was Diwali, btw). Manufacturing is around 80% of the index, so it determines IIP for the most part.

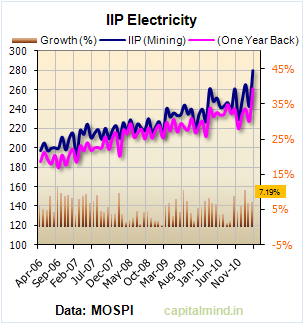
Electricity, the third player that completes the space, is up 7.19%. Electricity is about 10% of the index.
For the whole year, the growth came in at 7.8%. This is highly strange for a country that has, in nominal terms, grown 20%. I’m not sure if I should even trust this data enough to jump to conclusions, at least not for trading!
Would you like to see a better mapping of this data to see where growth was strong and such? I could create that as a treemap or that kind of visualization.