
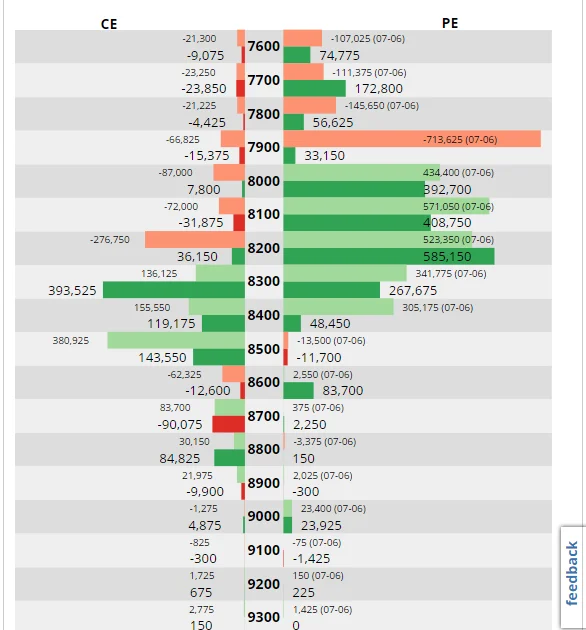
Snap: See Change in Open Interest in One Easy Chart!
We’ve made some cool additions to Capital Mind Snap and one of the new additions is the Change in Open Interest.On a chart that shows all the strike prices of the Nifty, we show the change in the open interest at each price. The change in open interest for each strike has:Coloured deep red when the OI falls, or deep green when the OI rises (today)Coloured lighter red or green for yesterday’s OI changeCalls on the left, puts on the right.The idea is to give a one stop look at all the options contract of the Nifty, and you can see how the OI is changing. Data is about 5 minutes delayed.You can use this to figure out how to position options strategies. One of the key things to know is - where is the market positioning Nifty moves? In the above graph, there is a relatively large amount of action in the 8100 and 8200 puts and in the 8300 calls. When the Nifty moves much more, action shifts to further time frames. It’s a great context to understand where players are concentrating positions.We’ll add such charts for other stocks too soon - a drop down selection. Would love your feedback