
World Stock Markets in Three Charts

World Stock Markets in Three Charts

World Stock Markets Compared in three charts

Anoop Vijaykumar1 min read
Quick Facts
What is "World Stock Markets in Three Charts" about?
World Stock Markets Compared in three charts
What category is this article in?
Stocks
Who wrote this article?
Anoop Vijaykumar, Capitalmind's research team.
When was this article published?
Published 30 August 2020.
How long does this article take to read?
1 min read
What topics does this article cover?
Charts and Analysis, Stock Markets
What does the "Chart 2: Worst Performing Stock Market Indices" section say?
Philippines, Austria, Dubai (DFM), Singapore (FTSE Straits) have the dubious distinction of being in the bottom 10 of world markets over 1, 3 and 5 years.
What does the "Chart 3: Key Stock Markets Compared with India" section say?
Comparing "key markets" with India, the Nasdaq 100 has an intimidating lead over the rest. Even over five years, the S&P500 has delivered more than double the Indian markets, and that is without currency adjustments.

Three quick charts based on comparing performance of over 70 stock market indices.

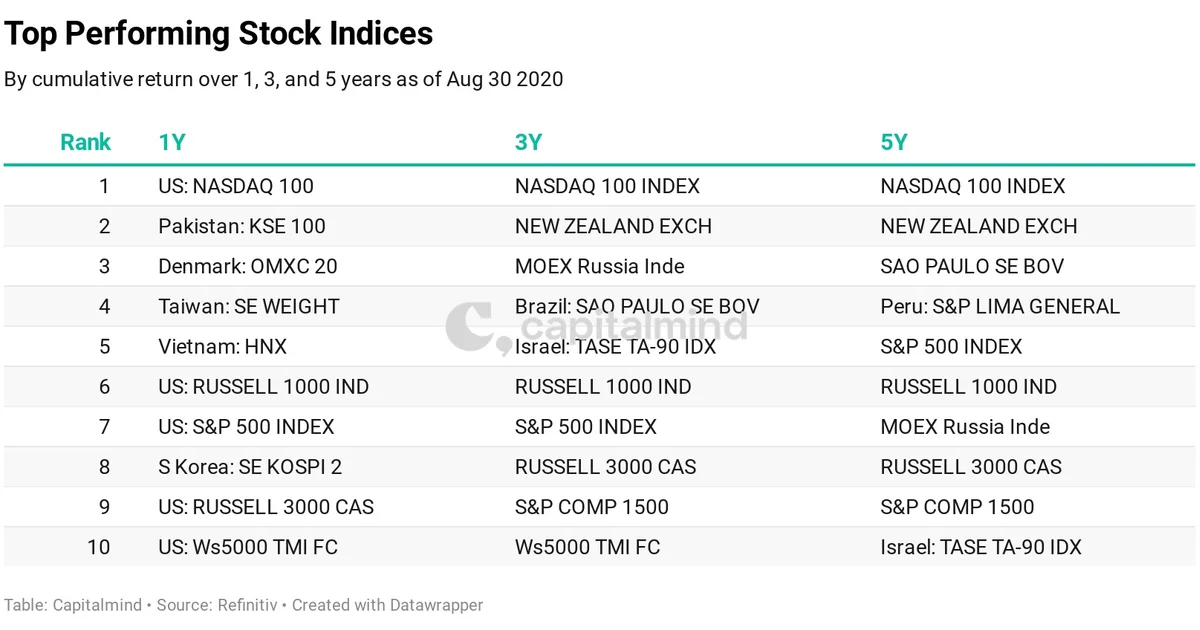
The best performing market over the last 1, 3 and 5 years is the Nasdaq 100 by a distance. Surprisingly, the 2nd best performer over the last one year is the Karachi Stock Index followed by the Copenhagen OMXC.

Over three and five years, the New Zealand Stock Market Index has returned the 2nd highest.

Chart 1: Top Performing Stock Market Indices

Chart 2: Worst Performing Stock Market Indices

Philippines, Austria, Dubai (DFM), Singapore (FTSE Straits) have the dubious distinction of being in the bottom 10 of world markets over 1, 3 and 5 years.

Chart 3: Key Stock Markets Compared with India

Comparing “key markets” with India, the Nasdaq 100 has an intimidating lead over the rest. Even over five years, the S&P500 has delivered more than double the Indian markets, and that is without currency adjustments.